公众号:尤而小屋
作者:Peter
编辑:Peter
大家好,我是Peter~
本文介绍用户群组分析Cohort analysis、RFM用户分层模型、Kmeans用户聚类模型的完整实施过程。
部分结果显示:
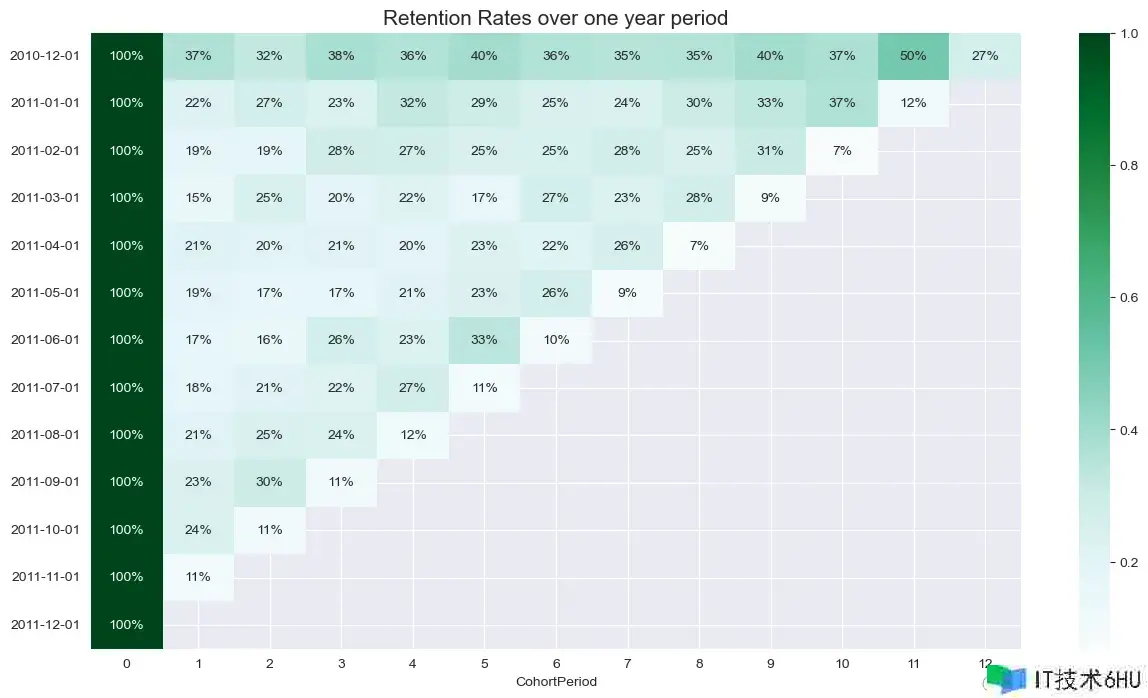
(1)群组分析-用户留存展示
(2)RFM模型-用户分层
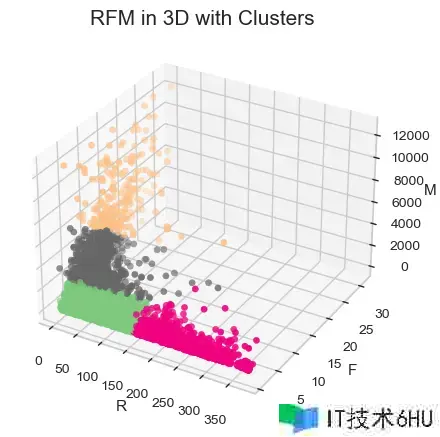
(3)用户聚类-划分簇群
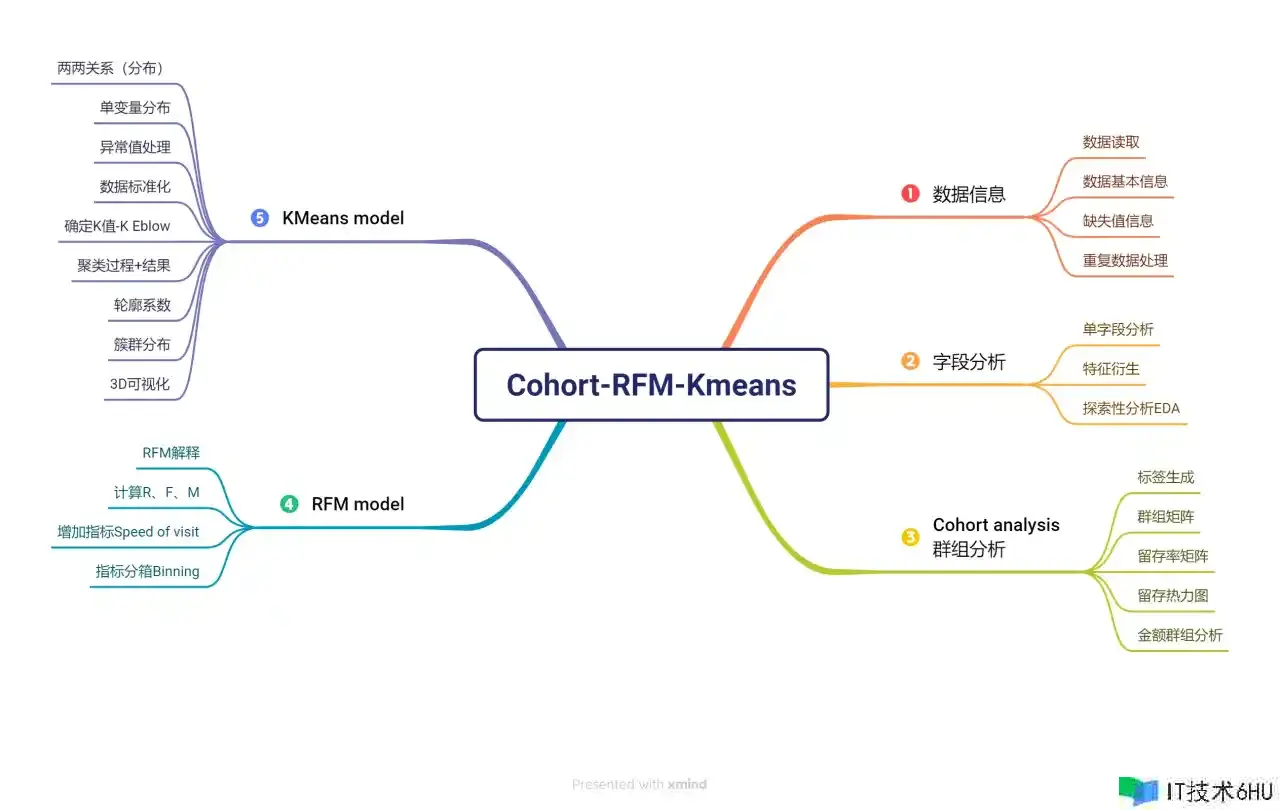
项目思维导图
提供项目的思维导图:
需要源码和数据的同学,到公众号:尤而小屋 后台联系小编
1 导入库-Import libraries
导入的第三方包主要包含数据处理、可视化、文本处理和聚类模型Kmeans等
In [1]:
import pandas as pd
import numpy as np
import seaborn as sns
sns.set_style("darkgrid")
import matplotlib.pyplot as plt
from mpl_toolkits import mplot3d
import plotly_express as px
import plotly.graph_objects as go
from sklearn.cluster import KMeans   # Kmeans聚类模型
from sklearn.metrics import silhouette_score # 聚类效果评价:轮廓系数
from sklearn.preprocessing import StandardScaler # 数据标准化
from wordcloud import WordCloud
import jieba
import nltk
from nltk.corpus import stopwords
from nltk.tokenize import word_tokenize
nltk.download('stopwords')
import string
import warnings
warnings.filterwarnings("ignore")
2 数据信息-Data information
2.1 读取数据-Read data
In [2]:
df = pd.read_excel("Online Retail.xlsx")
df.head()
Out[2]:
| InvoiceNo | StockCode | Description | Quantity | InvoiceDate | UnitPrice | CustomerID | Country | |
|---|---|---|---|---|---|---|---|---|
| 0 | 536365 | 85123A | WHITE HANGING HEART T-LIGHT HOLDER | 6 | 2010-12-01 08:26:00 | 2.55 | 17850.0 | United Kingdom |
| 1 | 536365 | 71053 | WHITE METAL LANTERN | 6 | 2010-12-01 08:26:00 | 3.39 | 17850.0 | United Kingdom |
| 2 | 536365 | 84406B | CREAM CUPID HEARTS COAT HANGER | 8 | 2010-12-01 08:26:00 | 2.75 | 17850.0 | United Kingdom |
| 3 | 536365 | 84029G | KNITTED UNION FLAG HOT WATER BOTTLE | 6 | 2010-12-01 08:26:00 | 3.39 | 17850.0 | United Kingdom |
| 4 | 536365 | 84029E | RED WOOLLY HOTTIE WHITE HEART. | 6 | 2010-12-01 08:26:00 | 3.39 | 17850.0 | United Kingdom |
2.2 数据基本信息-Data basic information
In [3]:
df.shape
Out[3]:
(541909, 8)
df.shape表示数据的行列数
In [4]:
df.dtypes # 每个字段的类型
Out[4]:
InvoiceNo              object
StockCode              object
Description            object
Quantity                int64
InvoiceDate    datetime64[ns]
UnitPrice             float64
CustomerID            float64
Country                object
dtype: object
本次数据中主要包含字符型object、数值型float/int64、时间类型datetime64[ns]。
输出所有的列字段名称:
In [5]:
df.columns
Out[5]:
Index(['InvoiceNo', 'StockCode', 'Description', 'Quantity', 'InvoiceDate',
       'UnitPrice', 'CustomerID', 'Country'],
      dtype='object')
In [6]:
df.info()  # 字段名、非缺失值个数、字段类型
<class 'pandas.core.frame.DataFrame'>
RangeIndex: 541909 entries, 0 to 541908
Data columns (total 8 columns):
 #   Column       Non-Null Count   Dtype
---  ------       --------------   -----
 0   InvoiceNo    541909 non-null  object
 1   StockCode    541909 non-null  object
 2   Description  540455 non-null  object
 3   Quantity     541909 non-null  int64
 4   InvoiceDate  541909 non-null  datetime64[ns]
 5   UnitPrice    541909 non-null  float64
 6   CustomerID   406829 non-null  float64
 7   Country      541909 non-null  object
dtypes: datetime64[ns](1), float64(2), int64(1), object(4)
memory usage: 33.1+ MB
2.3 缺失值信息-Missing information
输出每个字段缺失的个数:
In [7]:
df.isnull().sum()
Out[7]:
InvoiceNo           0
StockCode           0
Description      1454
Quantity            0
InvoiceDate         0
UnitPrice           0
CustomerID     135080
Country             0
dtype: int64
输出每个字段缺失的比例:
In [8]:
df.isnull().sum() / len(df)
Out[8]:
InvoiceNo      0.000000
StockCode      0.000000
Description    0.002683
Quantity       0.000000
InvoiceDate    0.000000
UnitPrice      0.000000
CustomerID     0.249267
Country        0.000000
dtype: float64
可以看到CustomerID字段的缺失值比例高达24.96%;但是该字段本身对数据分析影响不大。
2.4 重复数据-Duplicated data
查看数据中的重复值:
In [9]:
df[df.duplicated() == True].head()
Out[9]:
| InvoiceNo | StockCode | Description | Quantity | InvoiceDate | UnitPrice | CustomerID | Country | |
|---|---|---|---|---|---|---|---|---|
| 517 | 536409 | 21866 | UNION JACK FLAG LUGGAGE TAG | 1 | 2010-12-01 11:45:00 | 1.25 | 17908.0 | United Kingdom |
| 527 | 536409 | 22866 | HAND WARMER SCOTTY DOG DESIGN | 1 | 2010-12-01 11:45:00 | 2.10 | 17908.0 | United Kingdom |
| 537 | 536409 | 22900 | SET 2 TEA TOWELS I LOVE LONDON | 1 | 2010-12-01 11:45:00 | 2.95 | 17908.0 | United Kingdom |
| 539 | 536409 | 22111 | SCOTTIE DOG HOT WATER BOTTLE | 1 | 2010-12-01 11:45:00 | 4.95 | 17908.0 | United Kingdom |
| 555 | 536412 | 22327 | ROUND SNACK BOXES SET OF 4 SKULLS | 1 | 2010-12-01 11:49:00 | 2.95 | 17920.0 | United Kingdom |
In [10]:
df.duplicated().sum()
Out[10]:
5268
In [11]:
print(f"数据中总共的重复行数 {df.duplicated().sum()} 条")
数据中总共的重复行数 5268 条
我们直接取非重复的数据:
In [12]:
df.shape
Out[12]:
(541909, 8)
In [13]:
df = df[~df.duplicated()]
df.shape
Out[13]:
(536641, 8)
验证删除的重复数据:
In [14]:
536641 + 5268
Out[14]:
541909
3 字段分析-Columns analysis
3.1 InvoiceNo
In [15]:
df["InvoiceNo"].dtype # 字符类型
Out[15]:
dtype('O')
In [16]:
df["InvoiceNo"].value_counts() # 取值的数量
Out[16]:
InvoiceNo
573585     1114
581219      749
581492      731
580729      721
558475      705
           ...
570518        1
C550935       1
550937        1
550940        1
C558901       1
Name: count, Length: 25900, dtype: int64
如果是取消或者退货的订单,则会出现数量为负数,出现的以C开头的InvoiceNo则是退货或者取消订单的客户:
In [17]:
df[df["InvoiceNo"].str.startswith("C") == True].head(10) # 出现取消或退货的数据
Out[17]:
| InvoiceNo | StockCode | Description | Quantity | InvoiceDate | UnitPrice | CustomerID | Country | |
|---|---|---|---|---|---|---|---|---|
| 141 | C536379 | D | Discount | -1 | 2010-12-01 09:41:00 | 27.50 | 14527.0 | United Kingdom |
| 154 | C536383 | 35004C | SET OF 3 COLOURED FLYING DUCKS | -1 | 2010-12-01 09:49:00 | 4.65 | 15311.0 | United Kingdom |
| 235 | C536391 | 22556 | PLASTERS IN TIN CIRCUS PARADE | -12 | 2010-12-01 10:24:00 | 1.65 | 17548.0 | United Kingdom |
| 236 | C536391 | 21984 | PACK OF 12 PINK PAISLEY TISSUES | -24 | 2010-12-01 10:24:00 | 0.29 | 17548.0 | United Kingdom |
| 237 | C536391 | 21983 | PACK OF 12 BLUE PAISLEY TISSUES | -24 | 2010-12-01 10:24:00 | 0.29 | 17548.0 | United Kingdom |
| 238 | C536391 | 21980 | PACK OF 12 RED RETROSPOT TISSUES | -24 | 2010-12-01 10:24:00 | 0.29 | 17548.0 | United Kingdom |
| 239 | C536391 | 21484 | CHICK GREY HOT WATER BOTTLE | -12 | 2010-12-01 10:24:00 | 3.45 | 17548.0 | United Kingdom |
| 240 | C536391 | 22557 | PLASTERS IN TIN VINTAGE PAISLEY | -12 | 2010-12-01 10:24:00 | 1.65 | 17548.0 | United Kingdom |
| 241 | C536391 | 22553 | PLASTERS IN TIN SKULLS | -24 | 2010-12-01 10:24:00 | 1.65 | 17548.0 | United Kingdom |
| 939 | C536506 | 22960 | JAM MAKING SET WITH JARS | -6 | 2010-12-01 12:38:00 | 4.25 | 17897.0 | United Kingdom |
In [18]:
# 选择非C开头的用户
df = df[df["InvoiceNo"].str.startswith("C") != True]
df.shape
Out[18]:
(527390, 8)
In [19]:
print(f"总共不同的InvoiceNo数量为: {df['InvoiceNo'].nunique()}")
总共不同的InvoiceNo数量为: 22064
3.2 StockCode
In [20]:
df["StockCode"].dtype # 字符类型
Out[20]:
dtype('O')
In [21]:
print(f"总共不同的StockCode数量为: {df['StockCode'].nunique()}")
总共不同的StockCode数量为: 4059
In [22]:
df["StockCode"].value_counts()
Out[22]:
StockCode
85123A    2259
85099B    2112
22423     2012
47566     1700
20725     1582
          ...
22143        1
44242A       1
35644        1
90048        1
23843        1
Name: count, Length: 4059, dtype: int64
3.3 Description
In [23]:
df.columns
Out[23]:
Index(['InvoiceNo', 'StockCode', 'Description', 'Quantity', 'InvoiceDate',
       'UnitPrice', 'CustomerID', 'Country'],
      dtype='object')
In [24]:
des_list = df["Description"].tolist()  # 全部的Description列表
des_list[:5]
Out[24]:
['WHITE HANGING HEART T-LIGHT HOLDER',
 'WHITE METAL LANTERN',
 'CREAM CUPID HEARTS COAT HANGER',
 'KNITTED UNION FLAG HOT WATER BOTTLE',
 'RED WOOLLY HOTTIE WHITE HEART.']
In [25]:
des_list = [str(i) for i in des_list] # 评价中可能出现的数值强制转成字符串
In [26]:
text = " ".join(des_list)  # 所有数据构成的文本信息
text[:500]
Out[26]:
"WHITE HANGING HEART T-LIGHT HOLDER WHITE METAL LANTERN CREAM CUPID HEARTS COAT HANGER KNITTED UNION FLAG HOT WATER BOTTLE RED WOOLLY HOTTIE WHITE HEART. SET 7 BABUSHKA NESTING BOXES GLASS STAR FROSTED T-LIGHT HOLDER HAND WARMER UNION JACK HAND WARMER RED POLKA DOT ASSORTED COLOUR BIRD ORNAMENT POPPY'S PLAYHOUSE BEDROOM POPPY'S PLAYHOUSE KITCHEN FELTCRAFT PRINCESS CHARLOTTE DOLL IVORY KNITTED MUG COSY BOX OF 6 ASSORTED COLOUR TEASPOONS BOX OF VINTAGE JIGSAW BLOCKS BOX OF VINTAGE ALPHABET BLOCK"
In [27]:
# 初始化NLTK的停用词集
nltk_stopwords = set(stopwords.words('english'))
# 添加额外的停用词,比如标点符号
additional_stopwords = set(string.punctuation)
# 合并停用词集
stopwords_set = nltk_stopwords.union(additional_stopwords)
# 分词
words = word_tokenize(text)
# 去除停用词
filtered_words = [word for word in words if word.lower() not in stopwords_set]
# 将过滤后的单词连接成字符串,用空格分隔
filtered_text = ' '.join(filtered_words)
# 创建词云对象
wordcloud = WordCloud(width=800, height=400, background_color='white', min_font_size=10).generate(filtered_text)
# 显示词云图
plt.figure(figsize=(10, 5), facecolor=None)
plt.imshow(wordcloud)
plt.axis("off")
plt.tight_layout(pad=0)
plt.show()
3.4 Quantity
In [28]:
df["Quantity"].dtype # 数值类型
Out[28]:
dtype('int64')
数值类型的数据直接查看描述统计信息:
In [29]:
df["Quantity"].describe()
Out[29]:
count    527390.000000
mean         10.311272
std         160.367285
min       -9600.000000
25%           1.000000
50%           3.000000
75%          11.000000
max       80995.000000
Name: Quantity, dtype: float64
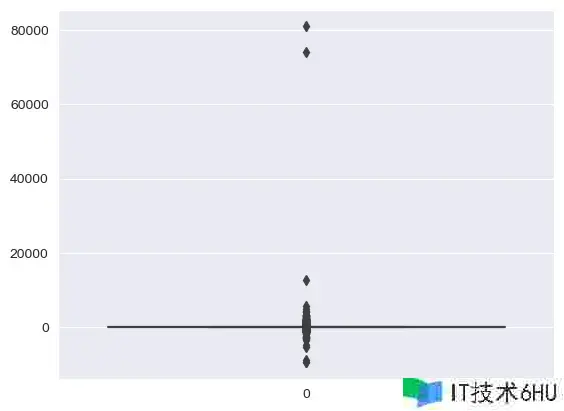
从min值中查看到,数据出现了负值,可能是取消或者退货的用户:直接删除
In [30]:
sns.boxplot(df["Quantity"])
plt.show()
同时70000以上的异常点,我们也直接删除:
In [31]:
df = df[(df["Quantity"] > 0) & (df["Quantity"] < 70000)]  # 只要大于0且小于70000的部分
df.shape
Out[31]:
(526052, 8)
3.5 InvoiceDate
In [32]:
df.columns
Out[32]:
Index(['InvoiceNo', 'StockCode', 'Description', 'Quantity', 'InvoiceDate',
       'UnitPrice', 'CustomerID', 'Country'],
      dtype='object')
In [33]:
df["InvoiceDate"].dtype # 时间类型数据
Out[33]:
dtype('<M8[ns]')
查看最早和最近的时间信息:
In [34]:
print("最早出现的时间:",df["InvoiceDate"].min())  # 最早时间
print("最近出现的时间:",df["InvoiceDate"].max())  # 最近时间
最早出现的时间: 2010-12-01 08:26:00
最近出现的时间: 2011-12-09 12:50:00
In [35]:
df["InvoiceDate"].value_counts()
Out[35]:
InvoiceDate
2011-10-31 14:41:00    1114
2011-12-08 09:28:00     749
2011-12-09 10:03:00     731
2011-12-05 17:24:00     721
2011-06-29 15:58:00     705
                       ...
2011-10-06 10:53:00       1
2011-01-07 14:44:00       1
2011-10-06 10:34:00       1
2011-05-27 16:23:00       1
2011-03-22 11:54:00       1
Name: count, Length: 19050, dtype: int64
可以看到出现最多的是2011-10-31的数据
3.6 UnitPrice
In [36]:
df["UnitPrice"].dtype # 浮点型
Out[36]:
dtype('float64')
In [37]:
df["UnitPrice"].describe()
Out[37]:
count    526052.000000
mean          3.871756
std          42.016640
min      -11062.060000
25%           1.250000
50%           2.080000
75%           4.130000
max       13541.330000
Name: UnitPrice, dtype: float64
观察到数据中存在负值,考虑直接删除:
In [38]:
df = df[df["UnitPrice"] > 0]  # 只要大于0的部分
df.shape
Out[38]:
(524876, 8)
3.7 Country
In [39]:
df["Country"].value_counts()[:20]
Out[39]:
Country
United Kingdom     479983
Germany              9025
France               8392
EIRE                 7879
Spain                2479
Netherlands          2359
Belgium              2031
Switzerland          1958
Portugal             1492
Australia            1181
Norway               1071
Italy                 758
Channel Islands       747
Finland               685
Cyprus                603
Sweden                450
Unspecified           442
Austria               398
Denmark               380
Poland                330
Name: count, dtype: int64
In [40]:
# 转化成比例
df["Country"].value_counts(normalize=True)[:20]
Out[40]:
Country
United Kingdom     0.914469
Germany            0.017195
France             0.015989
EIRE               0.015011
Spain              0.004723
Netherlands        0.004494
Belgium            0.003869
Switzerland        0.003730
Portugal           0.002843
Australia          0.002250
Norway             0.002040
Italy              0.001444
Channel Islands    0.001423
Finland            0.001305
Cyprus             0.001149
Sweden             0.000857
Unspecified        0.000842
Austria            0.000758
Denmark            0.000724
Poland             0.000629
Name: proportion, dtype: float64
可以看到91.44%的用户来自UK,所以直接将Country分为UK和Others
In [41]:
df["Country"] = df["Country"].apply(lambda x: "UK" if x == "United Kingdom" else "Others")
df["Country"].value_counts()
Out[41]:
Country
UK        479983
Others     44893
Name: count, dtype: int64
3.8 CustomerID
In [42]:
df.isnull().sum()
Out[42]:
InvoiceNo           0
StockCode           0
Description         0
Quantity            0
InvoiceDate         0
UnitPrice           0
CustomerID     132186
Country             0
dtype: int64
只有CustomerID中出现了缺失值,直接删除:
In [43]:
df = df[~df.CustomerID.isnull()]
df.shape
Out[43]:
(392690, 8)
经过处理后的数据信息:
In [44]:
df.info()
<class 'pandas.core.frame.DataFrame'>
Index: 392690 entries, 0 to 541908
Data columns (total 8 columns):
 #   Column       Non-Null Count   Dtype
---  ------       --------------   -----
 0   InvoiceNo    392690 non-null  object
 1   StockCode    392690 non-null  object
 2   Description  392690 non-null  object
 3   Quantity     392690 non-null  int64
 4   InvoiceDate  392690 non-null  datetime64[ns]
 5   UnitPrice    392690 non-null  float64
 6   CustomerID   392690 non-null  float64
 7   Country      392690 non-null  object
dtypes: datetime64[ns](1), float64(2), int64(1), object(4)
memory usage: 27.0+ MB
4 特征衍生-Feature derivation
In [45]:
# 总金额
df['Amount'] = df['Quantity']*df['UnitPrice']
In [46]:
# 时间特征
df['year'] = df['InvoiceDate'].dt.year # 年-月-日-小时-星期几
df['month'] = df['InvoiceDate'].dt.month
df['day'] = df['InvoiceDate'].dt.day
df['hour'] = df['InvoiceDate'].dt.hour
df['day_of_week'] = df['InvoiceDate'].dt.dayofweek
In [47]:
df.columns
Out[47]:
Index(['InvoiceNo', 'StockCode', 'Description', 'Quantity', 'InvoiceDate',
       'UnitPrice', 'CustomerID', 'Country', 'Amount', 'year', 'month', 'day',
       'hour', 'day_of_week'],
      dtype='object')
5 探索性数据分析Exploratory Data Analysis(EDA)
5.1 InvoiceNo & Amount
In [48]:
df[df["Country"] == "UK"].groupby("Description")["InvoiceNo"].nunique().sort_values(ascending=False)
Out[48]:
Description
WHITE HANGING HEART T-LIGHT HOLDER     1884
JUMBO BAG RED RETROSPOT                1447
REGENCY CAKESTAND 3 TIER               1410
ASSORTED COLOUR BIRD ORNAMENT          1300
PARTY BUNTING                          1290
                                       ...
GLASS AND BEADS BRACELET IVORY            1
GIRLY PINK TOOL SET                       1
BLUE/GREEN SHELL NECKLACE W PENDANT       1
WHITE ENAMEL FLOWER HAIR TIE              1
MIDNIGHT BLUE VINTAGE EARRINGS            1
Name: InvoiceNo, Length: 3843, dtype: int64
In [49]:
column = ['InvoiceNo','Amount']
# 设置图片大小
plt.figure(figsize=(15,5))
for i,j in enumerate(column):
    plt.subplot(1,2,i+1)  # 绘制子图
    # 基于Description分组统计InvoiceNo 或者 Amount下的唯一值个数,降序排列,取出前10个数据
    # x-数值(唯一值数据的个数)  y-index(具体名称)
    sns.barplot(x = df[df["Country"] == "UK"].groupby("Description")[j].nunique().sort_values(ascending=False).head(10).values,
                y = df[df["Country"] == "UK"].groupby("Description")[j].nunique().sort_values(ascending=False).head(10).index,
                color="blue"
               )
    plt.ylabel("")  # y轴label
    if i == 0:  # x轴label和挑剔设置
        plt.xlabel("Sum of quantity")
        plt.title("Top10 products purchased by customers in UK",size=12)
    else:
        plt.xlabel("Total Sales")
        plt.title("Top10 products with most sales in UK", size=12)
plt.tight_layout()
plt.show()
5.2 Country
In [50]:
Country =["Others","UK"]
# 设置图片大小
plt.figure(figsize=(15,5))
for i,j in enumerate(Country):
    plt.subplot(1,2,i+1)  # 绘制子图
    # 基于Description分组统计UnitPrice的均值,降序排列,取出前10个数据
    # x-数值(唯一值数据的个数)  y-index(具体名称)
    sns.barplot(x = df[df["Country"] == j].groupby("Description")["UnitPrice"].mean().sort_values(ascending=False).head(10).values,
                y = df[df["Country"] == j].groupby("Description")["UnitPrice"].mean().sort_values(ascending=False).head(10).index,
                color="yellow"
               )
    plt.ylabel("")  # y轴label
    if i == 0:  # x轴label和挑剔设置
        plt.xlabel("Unit Price")
        plt.title("Top10 products outside UK",size=12)
    else:
        plt.xlabel("Unit Price")
        plt.title("Top10 products in UK", size=12)
plt.tight_layout()
plt.show()
5.3 Quantity
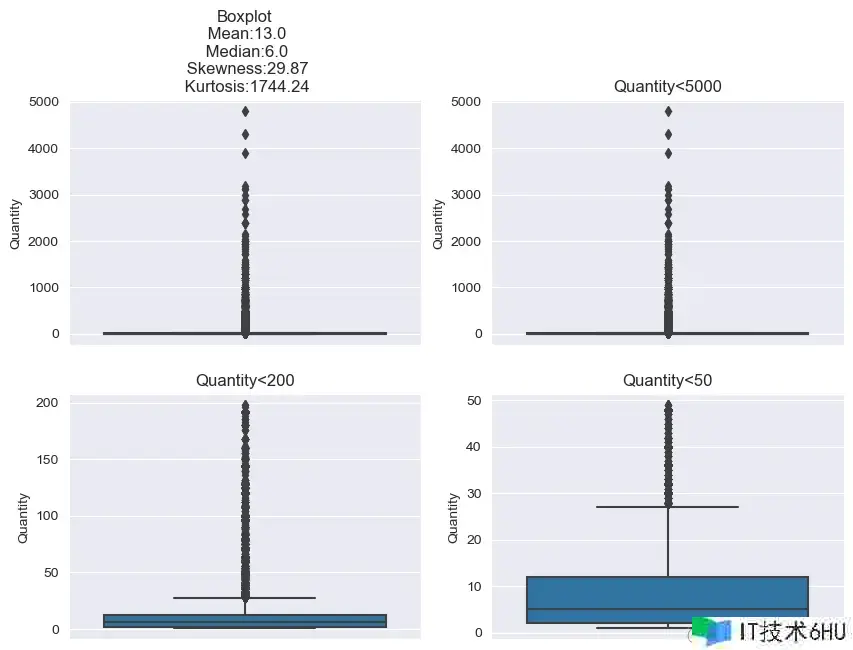
In [51]:
# 4个统计值信息:偏度、峰度、均值、中位数
skewness = round(df.Quantity.skew(),2)
kurtosis = round(df.Quantity.kurtosis(),2)
mean = round(np.mean(df.Quantity),0)
median = np.median(df.Quantity)
skewness, kurtosis, mean, median
Out[51]:
(29.87, 1744.24, 13.0, 6.0)
绘制4个子图:
In [52]:
plt.figure(figsize=(10,7))
# 第一个图体现完整数据信息
plt.subplot(2,2,1)
sns.boxplot(y=df.Quantity)
plt.title('Boxplotn Mean:{}n Median:{}n Skewness:{}n Kurtosis:{}'.format(mean,median,skewness,kurtosis))
# 第二个图体现小于5000的信息
plt.subplot(2,2,2)
sns.boxplot(y=df[df.Quantity<5000]['Quantity'])
plt.title('Quantity<5000')
# 第二个图体现小于200的信息
plt.subplot(2,2,3)
sns.boxplot(y=df[df.Quantity<200]['Quantity'])
plt.title('Quantity<200')
# 第二个图体现小于50的信息
plt.subplot(2,2,4)
sns.boxplot(y=df[df.Quantity<50]['Quantity'])
plt.title('Quantity<50')
plt.show()
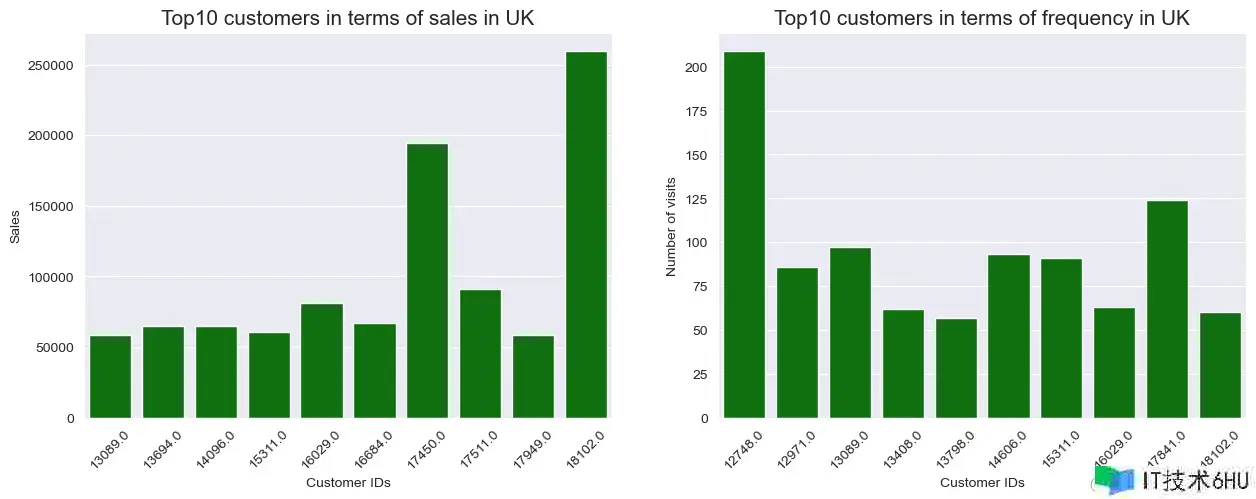
5.4 CustomerID & Amount
In [53]:
plt.figure(figsize=(15,5))
# 子图1
plt.subplot(1,2,1)
# x-index(具体名称)  y-和的大小排序,取前10
sns.barplot(x = df[df['Country']=='UK'].groupby('CustomerID')['Amount'].sum().sort_values(ascending=False).head(10).index,
            y = df[df['Country']=='UK'].groupby('CustomerID')['Amount'].sum().sort_values(ascending=False).head(10).values,
            color='green')
plt.xlabel('Customer IDs')
plt.ylabel('Sales')
plt.xticks(rotation=45)
plt.title('Top10 customers in terms of sales in UK',size=15)
# 子图2
plt.subplot(1,2,2)
# x-index(具体名称)  y-唯一值的大小排序,取前10
sns.barplot(x = df[df['Country']=='UK'].groupby('CustomerID')['InvoiceNo'].nunique().sort_values(ascending=False).head(10).index,
            y = df[df['Country']=='UK'].groupby('CustomerID')['InvoiceNo'].nunique().sort_values(ascending=False).head(10).values,
            color='green')
plt.xlabel('Customer IDs')
plt.ylabel('Number of visits')
plt.xticks(rotation=45)
plt.title('Top10 customers in terms of frequency in UK',size=15)
plt.show()
5.5 Amount by Year-Month
In [54]:
# 分组聚合统计
df[df["Country"] == "UK"].groupby(["year","month"])["Amount"].sum()
Out[54]:
year  month
2010  12       496477.340
2011  1        363692.730
      2        354618.200
      3        465784.190
      4        408733.111
      5        550359.350
      6        523775.590
      7        484545.591
      8        497194.910
      9        794806.692
      10       821220.130
      11       975251.390
      12       302912.220
Name: Amount, dtype: float64
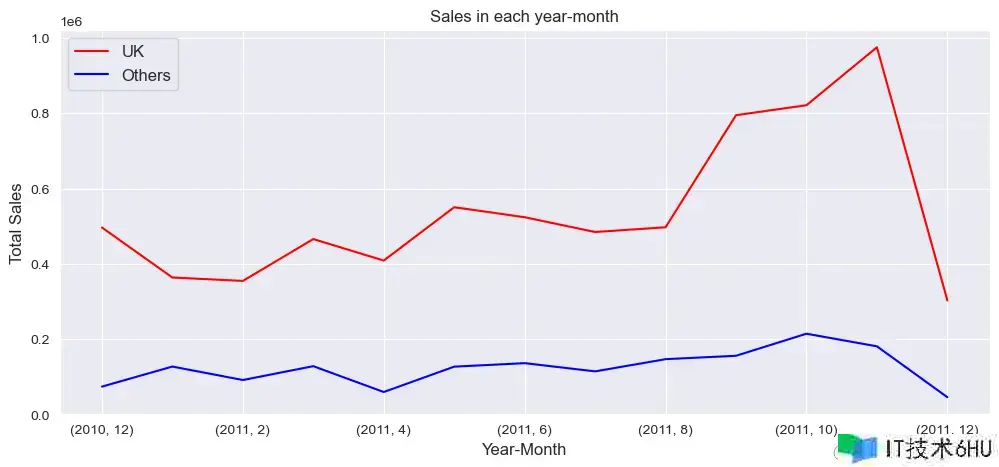
总金额Amount在每年每月的变化趋势:
In [55]:
plt.figure(figsize=(12,5))
# 按照年月分组统计总额Amount
df[df["Country"] == "UK"].groupby(["year","month"])["Amount"].sum().plot(kind="line", label="UK", color="red")
df[df["Country"] == "Others"].groupby(["year","month"])["Amount"].sum().plot(kind="line", label="Others", color="blue")
plt.xlabel("Year-Month", size=12)
plt.ylabel("Total Sales", size=12)
plt.title("Sales in each year-month",size=12)
plt.legend(fontsize=12)
plt.show()
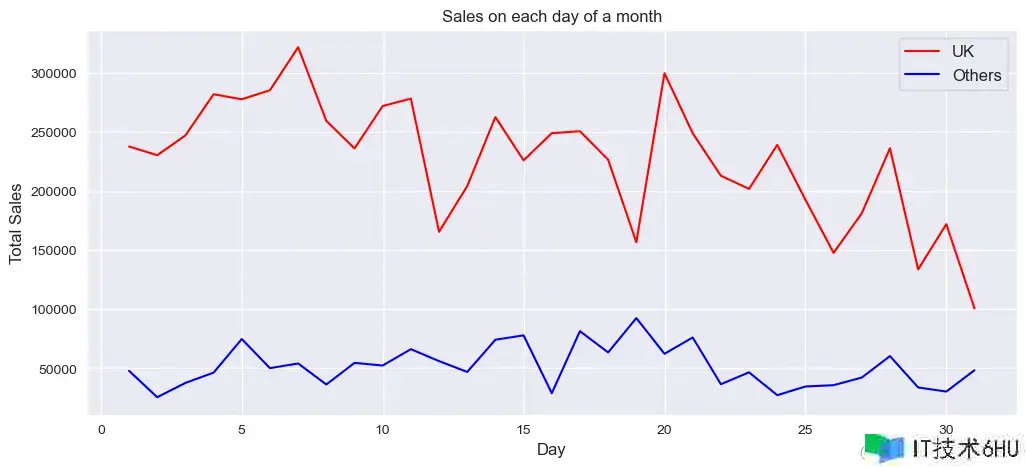
5.6 Amount by Day of Month
In [56]:
plt.figure(figsize=(12,5))
# 按照day分组统计总额Amount
df[df["Country"] == "UK"].groupby(["day"])["Amount"].sum().plot(kind="line", label="UK", color="red")
df[df["Country"] == "Others"].groupby(["day"])["Amount"].sum().plot(kind="line", label="Others", color="blue")
plt.xlabel("Day", size=12)
plt.ylabel("Total Sales", size=12)
plt.title("Sales on each day of a month",size=12)
plt.legend(fontsize=12)
plt.show()
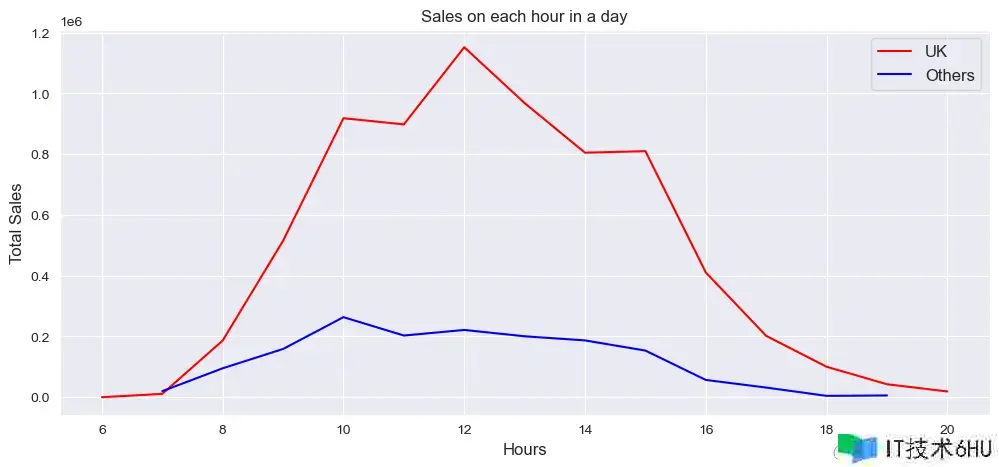
5.7 Amount by Hour
In [57]:
plt.figure(figsize=(12,5))
# 按照hour分组统计总额Amount
df[df["Country"] == "UK"].groupby(["hour"])["Amount"].sum().plot(kind="line", label="UK", color="red")
df[df["Country"] == "Others"].groupby(["hour"])["Amount"].sum().plot(kind="line", label="Others", color="blue")
plt.xlabel("Hours", size=12)
plt.ylabel("Total Sales", size=12)
plt.title("Sales on each hour in a day",size=12)
plt.legend(fontsize=12)
plt.show()
可以看到高峰期在每天的12点。
6 群组分析Cohort Analysis
In [58]:
df_c = df.copy() # 副本
df_c = df_c.iloc[:,:9]
df_c.head()
Out[58]:
| InvoiceNo | StockCode | Description | Quantity | InvoiceDate | UnitPrice | CustomerID | Country | Amount | |
|---|---|---|---|---|---|---|---|---|---|
| 0 | 536365 | 85123A | WHITE HANGING HEART T-LIGHT HOLDER | 6 | 2010-12-01 08:26:00 | 2.55 | 17850.0 | UK | 15.30 |
| 1 | 536365 | 71053 | WHITE METAL LANTERN | 6 | 2010-12-01 08:26:00 | 3.39 | 17850.0 | UK | 20.34 |
| 2 | 536365 | 84406B | CREAM CUPID HEARTS COAT HANGER | 8 | 2010-12-01 08:26:00 | 2.75 | 17850.0 | UK | 22.00 |
| 3 | 536365 | 84029G | KNITTED UNION FLAG HOT WATER BOTTLE | 6 | 2010-12-01 08:26:00 | 3.39 | 17850.0 | UK | 20.34 |
| 4 | 536365 | 84029E | RED WOOLLY HOTTIE WHITE HEART. | 6 | 2010-12-01 08:26:00 | 3.39 | 17850.0 | UK | 20.34 |
6.1 标签生成-Create Labels
在进行群组分析的时候,通常需要以下几个关键信息:
- InoiceMonth:客户每笔交易发生的年月
- CohortMonth:客户第一笔交易的发生的年月
- CohortPeriod:客户购买的生命周期,即客户每笔交易的时间与第一笔交易时间的间隔
1、用户每笔交易的发生时间InoiceMonth:
In [59]:
df_c["InvoiceMonth"] = df_c["InvoiceDate"].dt.strftime("%Y-%m")    # 字符类型
df_c["InvoiceMonth"] = pd.to_datetime(df_c["InvoiceMonth"])        # 转成时间类型
2、每个用户的第一笔交易的发生时间CohortMonth:
In [60]:
df_c.columns
Out[60]:
Index(['InvoiceNo', 'StockCode', 'Description', 'Quantity', 'InvoiceDate',
       'UnitPrice', 'CustomerID', 'Country', 'Amount', 'InvoiceMonth'],
      dtype='object')
In [61]:
# 基于客户分组,再取出InvoiceMonth的最小值
df_c["CohortMonth"] = df_c.groupby("CustomerID")["InvoiceMonth"].transform("min")
df_c["CohortMonth"] = pd.to_datetime(df_c["CohortMonth"])        # 转成时间类型
In [62]:
df_c.info()
<class 'pandas.core.frame.DataFrame'>
Index: 392690 entries, 0 to 541908
Data columns (total 11 columns):
 #   Column        Non-Null Count   Dtype
---  ------        --------------   -----
 0   InvoiceNo     392690 non-null  object
 1   StockCode     392690 non-null  object
 2   Description   392690 non-null  object
 3   Quantity      392690 non-null  int64
 4   InvoiceDate   392690 non-null  datetime64[ns]
 5   UnitPrice     392690 non-null  float64
 6   CustomerID    392690 non-null  float64
 7   Country       392690 non-null  object
 8   Amount        392690 non-null  float64
 9   InvoiceMonth  392690 non-null  datetime64[ns]
 10  CohortMonth   392690 non-null  datetime64[ns]
dtypes: datetime64[ns](3), float64(3), int64(1), object(4)
memory usage: 36.0+ MB
3、生成用户的购买生命周期CohortPeriod:
In [63]:
def diff(t1,t2):
    """
    df1和df2的时间差:以月计算
    """
    return (t1.dt.year - t2.dt.year) * 12 + t1.dt.month - t2.dt.month
In [64]:
# t1:df_c[""InvoiceMonth]
# t2:df_c[""CohortMonth]
df_c["CohortPeriod"] = diff(df_c["InvoiceMonth"], df_c["CohortMonth"])
In [65]:
df_c.sample(3) # 随机选择3条数据
Out[65]:
| InvoiceNo | StockCode | Description | Quantity | InvoiceDate | UnitPrice | CustomerID | Country | Amount | InvoiceMonth | CohortMonth | CohortPeriod | |
|---|---|---|---|---|---|---|---|---|---|---|---|---|
| 304617 | 563585 | 22694 | WICKER STAR | 2 | 2011-08-17 17:01:00 | 2.10 | 17070.0 | UK | 4.20 | 2011-08-01 | 2011-08-01 | 0 |
| 183274 | 552655 | 82486 | WOOD S/3 CABINET ANT WHITE FINISH | 1 | 2011-05-10 14:22:00 | 8.95 | 14587.0 | UK | 8.95 | 2011-05-01 | 2011-01-01 | 4 |
| 281380 | 561518 | 84828 | JUNGLE POPSICLES ICE LOLLY MOULDS | 12 | 2011-07-27 15:20:00 | 1.25 | 15261.0 | UK | 15.00 | 2011-07-01 | 2011-07-01 | 0 |
6.2 群组矩阵-Cohort Matrix
In [66]:
cohort_matrix = df_c.pivot_table(
    index="CohortMonth",
    columns="CohortPeriod",
    values="CustomerID",   #  基于CustomerID的唯一值
    aggfunc="nunique"
)
cohort_matrix
Out[66]:
| CohortPeriod | 0 | 1 | 2 | 3 | 4 | 5 | 6 | 7 | 8 | 9 | 10 | 11 | 12 |
|---|---|---|---|---|---|---|---|---|---|---|---|---|---|
| CohortMonth | |||||||||||||
| 2010-12-01 | 885.0 | 324.0 | 286.0 | 340.0 | 321.0 | 352.0 | 321.0 | 309.0 | 313.0 | 350.0 | 331.0 | 445.0 | 235.0 |
| 2011-01-01 | 416.0 | 92.0 | 111.0 | 96.0 | 134.0 | 120.0 | 103.0 | 101.0 | 125.0 | 136.0 | 152.0 | 49.0 | NaN |
| 2011-02-01 | 380.0 | 71.0 | 71.0 | 108.0 | 103.0 | 94.0 | 96.0 | 106.0 | 94.0 | 116.0 | 26.0 | NaN | NaN |
| 2011-03-01 | 452.0 | 68.0 | 114.0 | 90.0 | 101.0 | 76.0 | 121.0 | 104.0 | 126.0 | 39.0 | NaN | NaN | NaN |
| 2011-04-01 | 300.0 | 64.0 | 61.0 | 63.0 | 59.0 | 68.0 | 65.0 | 78.0 | 22.0 | NaN | NaN | NaN | NaN |
| 2011-05-01 | 284.0 | 54.0 | 49.0 | 49.0 | 59.0 | 66.0 | 75.0 | 26.0 | NaN | NaN | NaN | NaN | NaN |
| 2011-06-01 | 242.0 | 42.0 | 38.0 | 64.0 | 56.0 | 81.0 | 23.0 | NaN | NaN | NaN | NaN | NaN | NaN |
| 2011-07-01 | 188.0 | 34.0 | 39.0 | 42.0 | 51.0 | 21.0 | NaN | NaN | NaN | NaN | NaN | NaN | NaN |
| 2011-08-01 | 169.0 | 35.0 | 42.0 | 41.0 | 21.0 | NaN | NaN | NaN | NaN | NaN | NaN | NaN | NaN |
| 2011-09-01 | 299.0 | 70.0 | 90.0 | 34.0 | NaN | NaN | NaN | NaN | NaN | NaN | NaN | NaN | NaN |
| 2011-10-01 | 358.0 | 86.0 | 41.0 | NaN | NaN | NaN | NaN | NaN | NaN | NaN | NaN | NaN | NaN |
| 2011-11-01 | 323.0 | 36.0 | NaN | NaN | NaN | NaN | NaN | NaN | NaN | NaN | NaN | NaN | NaN |
| 2011-12-01 | 41.0 | NaN | NaN | NaN | NaN | NaN | NaN | NaN | NaN | NaN | NaN | NaN | NaN |
得到上面的群组矩阵,在每行数据中,CohortPeriod=0表示每个月出现了多少新客户;后面的表示每个月还剩余多少客户(留存人数)。
6.3 留存率矩阵Retention Rate Matrix
In [67]:
cohort_size = cohort_matrix.iloc[:, 0]
cohort_size
Out[67]:
CohortMonth
2010-12-01    885.0
2011-01-01    416.0
2011-02-01    380.0
2011-03-01    452.0
2011-04-01    300.0
2011-05-01    284.0
2011-06-01    242.0
2011-07-01    188.0
2011-08-01    169.0
2011-09-01    299.0
2011-10-01    358.0
2011-11-01    323.0
2011-12-01     41.0
Name: 0, dtype: float64
用每个月的留存人数除以第一个月的人数,得到对应的留存率:
In [68]:
retention = cohort_matrix.divide(cohort_size, axis=0)
retention
Out[68]:
| CohortPeriod | 0 | 1 | 2 | 3 | 4 | 5 | 6 | 7 | 8 | 9 | 10 | 11 | 12 |
|---|---|---|---|---|---|---|---|---|---|---|---|---|---|
| CohortMonth | |||||||||||||
| 2010-12-01 | 1.0 | 0.366102 | 0.323164 | 0.384181 | 0.362712 | 0.397740 | 0.362712 | 0.349153 | 0.353672 | 0.395480 | 0.374011 | 0.502825 | 0.265537 |
| 2011-01-01 | 1.0 | 0.221154 | 0.266827 | 0.230769 | 0.322115 | 0.288462 | 0.247596 | 0.242788 | 0.300481 | 0.326923 | 0.365385 | 0.117788 | NaN |
| 2011-02-01 | 1.0 | 0.186842 | 0.186842 | 0.284211 | 0.271053 | 0.247368 | 0.252632 | 0.278947 | 0.247368 | 0.305263 | 0.068421 | NaN | NaN |
| 2011-03-01 | 1.0 | 0.150442 | 0.252212 | 0.199115 | 0.223451 | 0.168142 | 0.267699 | 0.230088 | 0.278761 | 0.086283 | NaN | NaN | NaN |
| 2011-04-01 | 1.0 | 0.213333 | 0.203333 | 0.210000 | 0.196667 | 0.226667 | 0.216667 | 0.260000 | 0.073333 | NaN | NaN | NaN | NaN |
| 2011-05-01 | 1.0 | 0.190141 | 0.172535 | 0.172535 | 0.207746 | 0.232394 | 0.264085 | 0.091549 | NaN | NaN | NaN | NaN | NaN |
| 2011-06-01 | 1.0 | 0.173554 | 0.157025 | 0.264463 | 0.231405 | 0.334711 | 0.095041 | NaN | NaN | NaN | NaN | NaN | NaN |
| 2011-07-01 | 1.0 | 0.180851 | 0.207447 | 0.223404 | 0.271277 | 0.111702 | NaN | NaN | NaN | NaN | NaN | NaN | NaN |
| 2011-08-01 | 1.0 | 0.207101 | 0.248521 | 0.242604 | 0.124260 | NaN | NaN | NaN | NaN | NaN | NaN | NaN | NaN |
| 2011-09-01 | 1.0 | 0.234114 | 0.301003 | 0.113712 | NaN | NaN | NaN | NaN | NaN | NaN | NaN | NaN | NaN |
| 2011-10-01 | 1.0 | 0.240223 | 0.114525 | NaN | NaN | NaN | NaN | NaN | NaN | NaN | NaN | NaN | NaN |
| 2011-11-01 | 1.0 | 0.111455 | NaN | NaN | NaN | NaN | NaN | NaN | NaN | NaN | NaN | NaN | NaN |
| 2011-12-01 | 1.0 | NaN | NaN | NaN | NaN | NaN | NaN | NaN | NaN | NaN | NaN | NaN | NaN |
In [69]:
retention.index = pd.to_datetime(retention.index).date
retention.round(3) * 100  # 转换成百分比对应的大小
Out[69]:
| CohortPeriod | 0 | 1 | 2 | 3 | 4 | 5 | 6 | 7 | 8 | 9 | 10 | 11 | 12 |
|---|---|---|---|---|---|---|---|---|---|---|---|---|---|
| 2010-12-01 | 100.0 | 36.6 | 32.3 | 38.4 | 36.3 | 39.8 | 36.3 | 34.9 | 35.4 | 39.5 | 37.4 | 50.3 | 26.6 |
| 2011-01-01 | 100.0 | 22.1 | 26.7 | 23.1 | 32.2 | 28.8 | 24.8 | 24.3 | 30.0 | 32.7 | 36.5 | 11.8 | NaN |
| 2011-02-01 | 100.0 | 18.7 | 18.7 | 28.4 | 27.1 | 24.7 | 25.3 | 27.9 | 24.7 | 30.5 | 6.8 | NaN | NaN |
| 2011-03-01 | 100.0 | 15.0 | 25.2 | 19.9 | 22.3 | 16.8 | 26.8 | 23.0 | 27.9 | 8.6 | NaN | NaN | NaN |
| 2011-04-01 | 100.0 | 21.3 | 20.3 | 21.0 | 19.7 | 22.7 | 21.7 | 26.0 | 7.3 | NaN | NaN | NaN | NaN |
| 2011-05-01 | 100.0 | 19.0 | 17.3 | 17.3 | 20.8 | 23.2 | 26.4 | 9.2 | NaN | NaN | NaN | NaN | NaN |
| 2011-06-01 | 100.0 | 17.4 | 15.7 | 26.4 | 23.1 | 33.5 | 9.5 | NaN | NaN | NaN | NaN | NaN | NaN |
| 2011-07-01 | 100.0 | 18.1 | 20.7 | 22.3 | 27.1 | 11.2 | NaN | NaN | NaN | NaN | NaN | NaN | NaN |
| 2011-08-01 | 100.0 | 20.7 | 24.9 | 24.3 | 12.4 | NaN | NaN | NaN | NaN | NaN | NaN | NaN | NaN |
| 2011-09-01 | 100.0 | 23.4 | 30.1 | 11.4 | NaN | NaN | NaN | NaN | NaN | NaN | NaN | NaN | NaN |
| 2011-10-01 | 100.0 | 24.0 | 11.5 | NaN | NaN | NaN | NaN | NaN | NaN | NaN | NaN | NaN | NaN |
| 2011-11-01 | 100.0 | 11.1 | NaN | NaN | NaN | NaN | NaN | NaN | NaN | NaN | NaN | NaN | NaN |
| 2011-12-01 | 100.0 | NaN | NaN | NaN | NaN | NaN | NaN | NaN | NaN | NaN | NaN | NaN | NaN |
6.4 留存热力图Retention Rate Heatmap
基于上面的留存率矩阵绘制热力图:
In [70]:
plt.figure(figsize=(15,8))
sns.heatmap(data=retention,
            annot=True,
            fmt=".0%",
            cmap="BuGn"  # Blues,BuGn,GnBu,GnBu,PuRd,coolwarm,summer_r
           )
plt.title("Retention Rates over one year period", size=15)
plt.show()
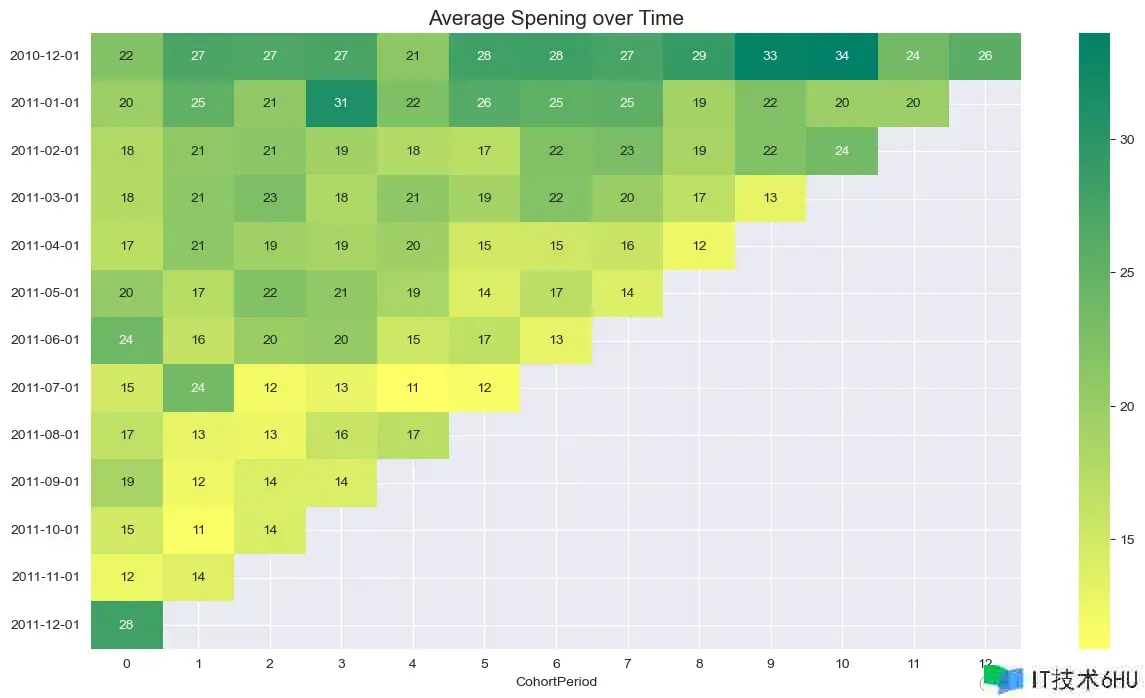
6.5 金额群组分析-Cohort Analysis of Amount
下面是基于总金额平均值的留存:
In [71]:
cohort_amount = df_c.pivot_table(
    index="CohortMonth",
    columns="CohortPeriod",
    values="Amount",   #  基于Amount的均值mean
    aggfunc="mean").round(2)  # 保留两位小数
cohort_amount
Out[71]:
| CohortPeriod | 0 | 1 | 2 | 3 | 4 | 5 | 6 | 7 | 8 | 9 | 10 | 11 | 12 |
|---|---|---|---|---|---|---|---|---|---|---|---|---|---|
| CohortMonth | |||||||||||||
| 2010-12-01 | 22.22 | 27.27 | 26.86 | 27.19 | 21.19 | 28.14 | 28.34 | 27.43 | 29.25 | 33.47 | 33.99 | 23.64 | 25.84 |
| 2011-01-01 | 19.79 | 25.10 | 20.97 | 31.23 | 22.48 | 26.28 | 25.24 | 25.49 | 19.07 | 22.33 | 19.73 | 19.78 | NaN |
| 2011-02-01 | 17.87 | 20.85 | 21.46 | 19.36 | 17.69 | 16.98 | 22.17 | 22.90 | 18.79 | 22.18 | 23.50 | NaN | NaN |
| 2011-03-01 | 17.59 | 21.14 | 22.69 | 18.02 | 21.11 | 19.00 | 22.03 | 19.99 | 16.81 | 13.20 | NaN | NaN | NaN |
| 2011-04-01 | 16.95 | 21.03 | 19.49 | 18.74 | 19.55 | 15.00 | 15.25 | 15.97 | 12.34 | NaN | NaN | NaN | NaN |
| 2011-05-01 | 20.48 | 17.34 | 22.25 | 20.90 | 18.59 | 14.12 | 17.02 | 14.04 | NaN | NaN | NaN | NaN | NaN |
| 2011-06-01 | 23.98 | 16.29 | 19.95 | 20.45 | 15.35 | 16.71 | 13.22 | NaN | NaN | NaN | NaN | NaN | NaN |
| 2011-07-01 | 14.96 | 23.53 | 11.79 | 13.02 | 10.88 | 11.68 | NaN | NaN | NaN | NaN | NaN | NaN | NaN |
| 2011-08-01 | 16.52 | 13.16 | 12.53 | 15.88 | 17.00 | NaN | NaN | NaN | NaN | NaN | NaN | NaN | NaN |
| 2011-09-01 | 18.81 | 12.29 | 14.15 | 14.27 | NaN | NaN | NaN | NaN | NaN | NaN | NaN | NaN | NaN |
| 2011-10-01 | 15.08 | 11.34 | 14.46 | NaN | NaN | NaN | NaN | NaN | NaN | NaN | NaN | NaN | NaN |
| 2011-11-01 | 12.49 | 13.84 | NaN | NaN | NaN | NaN | NaN | NaN | NaN | NaN | NaN | NaN | NaN |
| 2011-12-01 | 28.10 | NaN | NaN | NaN | NaN | NaN | NaN | NaN | NaN | NaN | NaN | NaN | NaN |
In [72]:
cohort_amount.index = pd.to_datetime(cohort_amount.index).date  # 索引的改变
cohort_amount
Out[72]:
| CohortPeriod | 0 | 1 | 2 | 3 | 4 | 5 | 6 | 7 | 8 | 9 | 10 | 11 | 12 |
|---|---|---|---|---|---|---|---|---|---|---|---|---|---|
| 2010-12-01 | 22.22 | 27.27 | 26.86 | 27.19 | 21.19 | 28.14 | 28.34 | 27.43 | 29.25 | 33.47 | 33.99 | 23.64 | 25.84 |
| 2011-01-01 | 19.79 | 25.10 | 20.97 | 31.23 | 22.48 | 26.28 | 25.24 | 25.49 | 19.07 | 22.33 | 19.73 | 19.78 | NaN |
| 2011-02-01 | 17.87 | 20.85 | 21.46 | 19.36 | 17.69 | 16.98 | 22.17 | 22.90 | 18.79 | 22.18 | 23.50 | NaN | NaN |
| 2011-03-01 | 17.59 | 21.14 | 22.69 | 18.02 | 21.11 | 19.00 | 22.03 | 19.99 | 16.81 | 13.20 | NaN | NaN | NaN |
| 2011-04-01 | 16.95 | 21.03 | 19.49 | 18.74 | 19.55 | 15.00 | 15.25 | 15.97 | 12.34 | NaN | NaN | NaN | NaN |
| 2011-05-01 | 20.48 | 17.34 | 22.25 | 20.90 | 18.59 | 14.12 | 17.02 | 14.04 | NaN | NaN | NaN | NaN | NaN |
| 2011-06-01 | 23.98 | 16.29 | 19.95 | 20.45 | 15.35 | 16.71 | 13.22 | NaN | NaN | NaN | NaN | NaN | NaN |
| 2011-07-01 | 14.96 | 23.53 | 11.79 | 13.02 | 10.88 | 11.68 | NaN | NaN | NaN | NaN | NaN | NaN | NaN |
| 2011-08-01 | 16.52 | 13.16 | 12.53 | 15.88 | 17.00 | NaN | NaN | NaN | NaN | NaN | NaN | NaN | NaN |
| 2011-09-01 | 18.81 | 12.29 | 14.15 | 14.27 | NaN | NaN | NaN | NaN | NaN | NaN | NaN | NaN | NaN |
| 2011-10-01 | 15.08 | 11.34 | 14.46 | NaN | NaN | NaN | NaN | NaN | NaN | NaN | NaN | NaN | NaN |
| 2011-11-01 | 12.49 | 13.84 | NaN | NaN | NaN | NaN | NaN | NaN | NaN | NaN | NaN | NaN | NaN |
| 2011-12-01 | 28.10 | NaN | NaN | NaN | NaN | NaN | NaN | NaN | NaN | NaN | NaN | NaN | NaN |
基于上述结果的热力图展示:
In [73]:
plt.figure(figsize=(15,8))
sns.heatmap(data=cohort_amount,annot=True,cmap="summer_r")
plt.title("Average Spening over Time", size=15)
plt.show()
7 RFM model
7.1 RFM解释-Explanation
- Recency(近度):指自客户最后一次与品牌进行活动或交易以来已经过去的时间
- Frequency(频度):指在一定时期内,客户与品牌进行交易或互动的频率
- Monetary(金额):也称为“货币价值”,这个因素反映了客户在一定时期内与品牌交易的总金额
In [74]:
df_rfm = df.copy()
df_rfm = df_rfm.iloc[:,:9]
df_rfm.head()
Out[74]:
| InvoiceNo | StockCode | Description | Quantity | InvoiceDate | UnitPrice | CustomerID | Country | Amount | |
|---|---|---|---|---|---|---|---|---|---|
| 0 | 536365 | 85123A | WHITE HANGING HEART T-LIGHT HOLDER | 6 | 2010-12-01 08:26:00 | 2.55 | 17850.0 | UK | 15.30 |
| 1 | 536365 | 71053 | WHITE METAL LANTERN | 6 | 2010-12-01 08:26:00 | 3.39 | 17850.0 | UK | 20.34 |
| 2 | 536365 | 84406B | CREAM CUPID HEARTS COAT HANGER | 8 | 2010-12-01 08:26:00 | 2.75 | 17850.0 | UK | 22.00 |
| 3 | 536365 | 84029G | KNITTED UNION FLAG HOT WATER BOTTLE | 6 | 2010-12-01 08:26:00 | 3.39 | 17850.0 | UK | 20.34 |
| 4 | 536365 | 84029E | RED WOOLLY HOTTIE WHITE HEART. | 6 | 2010-12-01 08:26:00 | 3.39 | 17850.0 | UK | 20.34 |
7.2 Calculate R
In [75]:
# 每个ID下日期的最大值,也就是最近的一次消费时间
R = df_rfm.groupby("CustomerID")["InvoiceDate"].max().reset_index()
R.head()
Out[75]:
| CustomerID | InvoiceDate | |
|---|---|---|
| 0 | 12347.0 | 2011-12-07 15:52:00 |
| 1 | 12348.0 | 2011-09-25 13:13:00 |
| 2 | 12349.0 | 2011-11-21 09:51:00 |
| 3 | 12350.0 | 2011-02-02 16:01:00 |
| 4 | 12352.0 | 2011-11-03 14:37:00 |
In [76]:
R['InvoiceDate'] = pd.to_datetime(R['InvoiceDate']).dt.date    # 取出年月日
R["MaxDate"] = R["InvoiceDate"].max()    # 找出数据中的最大时间点
In [77]:
R["MaxDate"] = pd.to_datetime(R["MaxDate"])  # 转成时间类型数据
R["InvoiceDate"] = pd.to_datetime(R["InvoiceDate"])
In [78]:
R["Recency"] = (R["MaxDate"] - R["InvoiceDate"]).dt.days + 1
R.head()
Out[78]:
| CustomerID | InvoiceDate | MaxDate | Recency | |
|---|---|---|---|---|
| 0 | 12347.0 | 2011-12-07 | 2011-12-09 | 3 |
| 1 | 12348.0 | 2011-09-25 | 2011-12-09 | 76 |
| 2 | 12349.0 | 2011-11-21 | 2011-12-09 | 19 |
| 3 | 12350.0 | 2011-02-02 | 2011-12-09 | 311 |
| 4 | 12352.0 | 2011-11-03 | 2011-12-09 | 37 |
In [79]:
R = R[['CustomerID','Recency']]
R.columns = ['CustomerID','R']
7.3 Calculate F
计算购买频次
In [80]:
F = df_rfm.groupby('CustomerID')['InvoiceNo'].nunique().reset_index()
F.head()
Out[80]:
| CustomerID | InvoiceNo | |
|---|---|---|
| 0 | 12347.0 | 7 |
| 1 | 12348.0 | 4 |
| 2 | 12349.0 | 1 |
| 3 | 12350.0 | 1 |
| 4 | 12352.0 | 8 |
In [81]:
F.columns = ['CustomerID','F']
7.4 Calculate M
计算每个客户的总金额
In [82]:
M = df_rfm.groupby('CustomerID')['Amount'].sum().reset_index()
In [83]:
M.columns = ['CustomerID','M']
7.5 合并数据1-Merge Data
In [84]:
RFM = pd.merge(pd.merge(R,F),M)
RFM.head()
Out[84]:
| CustomerID | R | F | M | |
|---|---|---|---|---|
| 0 | 12347.0 | 3 | 7 | 4310.00 |
| 1 | 12348.0 | 76 | 4 | 1797.24 |
| 2 | 12349.0 | 19 | 1 | 1757.55 |
| 3 | 12350.0 | 311 | 1 | 334.40 |
| 4 | 12352.0 | 37 | 8 | 2506.04 |
7.6 Speed of Visit
在RFM模型中添加一个新指标:访问速度-Speed of Visit,用来表示用户平均回访时间,告诉我们客户平均多少天会再次光顾。
以客户17850为例,如何求出该客户的回访速度:
In [85]:
# 某位用户(17850)在不同Date下的访问次数统计count
df_17850 = df_rfm[df_rfm["CustomerID"] == 17850].groupby("InvoiceDate")["InvoiceNo"].count().reset_index()
df_17850.head()
Out[85]:
| InvoiceDate | InvoiceNo | |
|---|---|---|
| 0 | 2010-12-01 08:26:00 | 7 |
| 1 | 2010-12-01 08:28:00 | 2 |
| 2 | 2010-12-01 09:01:00 | 2 |
| 3 | 2010-12-01 09:02:00 | 16 |
| 4 | 2010-12-01 09:32:00 | 16 |
将访问日期InvoiceDate一个单位后,再对两个日期做差值,最后对全部的差值求出均值,作为最终的平均回访天数:
In [86]:
df_17850["InvoiceDate1"] = df_17850["InvoiceDate"].shift(1)  # 移动一个单位
df_17850["Diff"] = (df_17850["InvoiceDate"] - df_17850["InvoiceDate"]).dt.days  # 两次相邻日期的间隔天数
df_17850.head()
Out[86]:
| InvoiceDate | InvoiceNo | InvoiceDate1 | Diff | |
|---|---|---|---|---|
| 0 | 2010-12-01 08:26:00 | 7 | NaT | 0 |
| 1 | 2010-12-01 08:28:00 | 2 | 2010-12-01 08:26:00 | 0 |
| 2 | 2010-12-01 09:01:00 | 2 | 2010-12-01 08:28:00 | 0 |
| 3 | 2010-12-01 09:02:00 | 16 | 2010-12-01 09:01:00 | 0 |
| 4 | 2010-12-01 09:32:00 | 16 | 2010-12-01 09:02:00 | 0 |
该用户的平均回访天数:
In [87]:
mean_days_17850 = round(df_17850.Diff.mean(),0)  # 平均天数
mean_days_17850
Out[87]:
0.0
全部用户的处理:
In [88]:
customer_list = list(df_rfm.CustomerID.unique())
customers = []
values = []
for c in customer_list:
    sov = df_rfm[df_rfm["CustomerID"] == c].groupby("InvoiceDate")["InvoiceNo"].count().reset_index()
    if sov.shape[0] > 1:  # 不同天数的记录数必须大于1
        sov["InvoiceDate1"] = sov["InvoiceDate"].shift(1)  #  移动一个单位
        sov["Diff"] = (sov["InvoiceDate"] - sov["InvoiceDate1"]).dt.days
        mean_day = round(sov["Diff"].mean(), 0)
        # 存放用户名和对应的回访天数
        customers.append(c)
        values.append(mean_day)
    else:
        customers.append(c)
        values.append(0)
在这里求出了每个用户的平均回访间隔时间:
In [89]:
speed_of_visit = pd.DataFrame({"CustomerID":customers, "Speed_of_Visit":values})
speed_of_visit = speed_of_visit.sort_values("CustomerID")
7.7 合并数据2
将新指标speed_of_visit添加到RFM模型的结果中:
In [90]:
RFM = pd.merge(RFM, speed_of_visit)
RFM.head()
Out[90]:
| CustomerID | R | F | M | Speed_of_Visit | |
|---|---|---|---|---|---|
| 0 | 12347.0 | 3 | 7 | 4310.00 | 60.0 |
| 1 | 12348.0 | 76 | 4 | 1797.24 | 94.0 |
| 2 | 12349.0 | 19 | 1 | 1757.55 | 0.0 |
| 3 | 12350.0 | 311 | 1 | 334.40 | 0.0 |
| 4 | 12352.0 | 37 | 8 | 2506.04 | 37.0 |
完整RFM模型的数据信息:
In [91]:
RFM.describe(percentiles=[0.25,0.5,0.75,0.9,0.95,0.99])
Out[91]:
| CustomerID | R | F | M | Speed_of_Visit | |
|---|---|---|---|---|---|
| count | 4337.000000 | 4337.000000 | 4337.000000 | 4337.000000 | 4337.000000 |
| mean | 15301.089232 | 93.053032 | 4.272539 | 1992.519182 | 47.305741 |
| std | 1721.422291 | 99.966159 | 7.698808 | 8547.583474 | 63.041837 |
| min | 12347.000000 | 1.000000 | 1.000000 | 2.900000 | 0.000000 |
| 25% | 13814.000000 | 18.000000 | 1.000000 | 306.450000 | 0.000000 |
| 50% | 15300.000000 | 51.000000 | 2.000000 | 668.430000 | 28.000000 |
| 75% | 16779.000000 | 143.000000 | 5.000000 | 1657.280000 | 68.000000 |
| 90% | 17687.600000 | 263.000000 | 9.000000 | 3638.770000 | 123.000000 |
| 95% | 17984.200000 | 312.000000 | 13.000000 | 5742.946000 | 176.000000 |
| 99% | 18225.640000 | 369.640000 | 30.000000 | 18804.146000 | 305.640000 |
| max | 18287.000000 | 374.000000 | 209.000000 | 280206.020000 | 365.000000 |
7.8 指标分箱-Binning
7.8.1 分箱过程process of Binning
In [92]:
#  bins根据min-25%-50%-75%-90%-max来确定,注意边界值
RFM["R_score"] = pd.cut(RFM["R"], bins=[0,18,51,143,263,375],labels=[5,4,3,2,1])
RFM["R_score"] = RFM["R_score"].astype("int")
RFM["R_score"]
Out[92]:
0       5
1       3
2       4
3       1
4       4
       ..
4332    1
4333    2
4334    5
4335    5
4336    4
Name: R_score, Length: 4337, dtype: int32
In [93]:
RFM["F_score"] = pd.cut(RFM["F"], bins=[0,1,2,5,9,210],labels=[1,2,3,4,5])  # 根据min-25%-50%-75%-90%-max来确定,注意边界值
RFM["F_score"] = RFM["F_score"].astype("int")
In [94]:
RFM["M_score"] = pd.cut(RFM["M"], bins=[2,307,669,1658,3639,290000],labels=[1,2,3,4,5])  # 根据min-25%-50%-75%-90%-max来确定,注意边界值
RFM["M_score"] = RFM["M_score"].astype("int")
In [95]:
RFM.info()
<class 'pandas.core.frame.DataFrame'>
RangeIndex: 4337 entries, 0 to 4336
Data columns (total 8 columns):
 #   Column          Non-Null Count  Dtype
---  ------          --------------  -----
 0   CustomerID      4337 non-null   float64
 1   R               4337 non-null   int64
 2   F               4337 non-null   int64
 3   M               4337 non-null   float64
 4   Speed_of_Visit  4337 non-null   float64
 5   R_score         4337 non-null   int32
 6   F_score         4337 non-null   int32
 7   M_score         4337 non-null   int32
dtypes: float64(3), int32(3), int64(2)
memory usage: 220.4 KB
根据三个指标的得分计算总分数:
7.8.2 总得分-Total score
In [96]:
#  总得分
RFM["score"] = RFM["R_score"] + RFM["F_score"] + RFM["M_score"]
RFM.head()
Out[96]:
| CustomerID | R | F | M | Speed_of_Visit | R_score | F_score | M_score | score | |
|---|---|---|---|---|---|---|---|---|---|
| 0 | 12347.0 | 3 | 7 | 4310.00 | 60.0 | 5 | 4 | 5 | 14 |
| 1 | 12348.0 | 76 | 4 | 1797.24 | 94.0 | 3 | 3 | 4 | 10 |
| 2 | 12349.0 | 19 | 1 | 1757.55 | 0.0 | 4 | 1 | 4 | 9 |
| 3 | 12350.0 | 311 | 1 | 334.40 | 0.0 | 1 | 1 | 2 | 4 |
| 4 | 12352.0 | 37 | 8 | 2506.04 | 37.0 | 4 | 4 | 4 | 12 |
In [97]:
RFM["score"].describe(percentiles=[0.25,0.5,0.75,0.9,0.95,0.99])
Out[97]:
count    4337.000000
mean        8.415495
std         3.312982
min         3.000000
25%         6.000000
50%         8.000000
75%        11.000000
90%        13.000000
95%        15.000000
99%        15.000000
max        15.000000
Name: score, dtype: float64
7.8.3 分箱结果-Result of binning
In [98]:
RFM["customer_type"] = pd.cut(RFM["score"],  # 待分箱的数据
                              bins=[0,6,8,11,13,16],  # 箱体边界值
                              labels=["Bad","Bronze","Silver","Gold","Platinum"]  # 每个箱体的取值名称,字符串或者数值型皆可
                             )
RFM.head()
Out[98]:
| CustomerID | R | F | M | Speed_of_Visit | R_score | F_score | M_score | score | customer_type | |
|---|---|---|---|---|---|---|---|---|---|---|
| 0 | 12347.0 | 3 | 7 | 4310.00 | 60.0 | 5 | 4 | 5 | 14 | Platinum |
| 1 | 12348.0 | 76 | 4 | 1797.24 | 94.0 | 3 | 3 | 4 | 10 | Silver |
| 2 | 12349.0 | 19 | 1 | 1757.55 | 0.0 | 4 | 1 | 4 | 9 | Silver |
| 3 | 12350.0 | 311 | 1 | 334.40 | 0.0 | 1 | 1 | 2 | 4 | Bad |
| 4 | 12352.0 | 37 | 8 | 2506.04 | 37.0 | 4 | 4 | 4 | 12 | Gold |
不同等级用户的人数统计对比:
In [99]:
RFM["customer_type"].value_counts(normalize=True)
Out[99]:
customer_type
Bad         0.331566
Silver      0.276920
Bronze      0.198755
Gold        0.104450
Platinum    0.088310
Name: proportion, dtype: float64
7.8.4 不同类型用户数-Count of customer_type
In [100]:
RFM.groupby("customer_type")[["R","F","M"]].mean().round(0)
Out[100]:
| R | F | M | |
|---|---|---|---|
| customer_type | |||
| Bad | 188.0 | 1.0 | 294.0 |
| Bronze | 78.0 | 2.0 | 622.0 |
| Silver | 44.0 | 4.0 | 1413.0 |
| Gold | 20.0 | 7.0 | 2932.0 |
| Platinum | 10.0 | 19.0 | 12159.0 |
可视化的效果:
In [101]:
columns = ["R","F","M"]
plt.figure(figsize=(15,4))
for i, j in enumerate(columns):
    plt.subplot(1,3,i+1)
    RFM.groupby("customer_type")[j].mean().round(0).plot(kind="bar", color="blue")
    plt.title(f"{j} of each customer type", size=12)
    plt.xlabel("")
    plt.xticks(rotation=45)
plt.show()
8 聚类K-Means Clustering
In [102]:
df_kmeans = RFM.copy()
df_kmeans = df_kmeans.iloc[:,:4]
df_kmeans.head()
Out[102]:
| CustomerID | R | F | M | |
|---|---|---|---|---|
| 0 | 12347.0 | 3 | 7 | 4310.00 |
| 1 | 12348.0 | 76 | 4 | 1797.24 |
| 2 | 12349.0 | 19 | 1 | 1757.55 |
| 3 | 12350.0 | 311 | 1 | 334.40 |
| 4 | 12352.0 | 37 | 8 | 2506.04 |
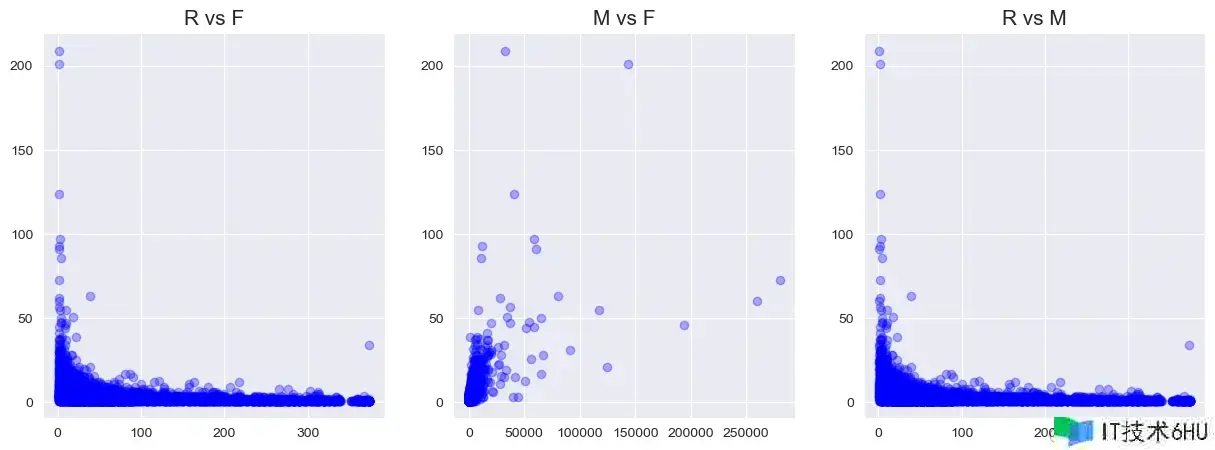
8.1 两两关系-Relations of two variables
In [103]:
plt.figure(figsize=(15,5))
plt.subplot(1,3,1)
plt.scatter(df_kmeans.R, df_kmeans.F, color='blue', alpha=0.3)
plt.title('R vs F', size=15)
plt.subplot(1,3,2)
plt.scatter(df_kmeans.M, df_kmeans.F, color='blue', alpha=0.3)
plt.title('M vs F', size=15)
plt.subplot(1,3,3)
plt.scatter(df_kmeans.R, df_kmeans.F, color='blue', alpha=0.3)
plt.title('R vs M', size=15)
plt.show()
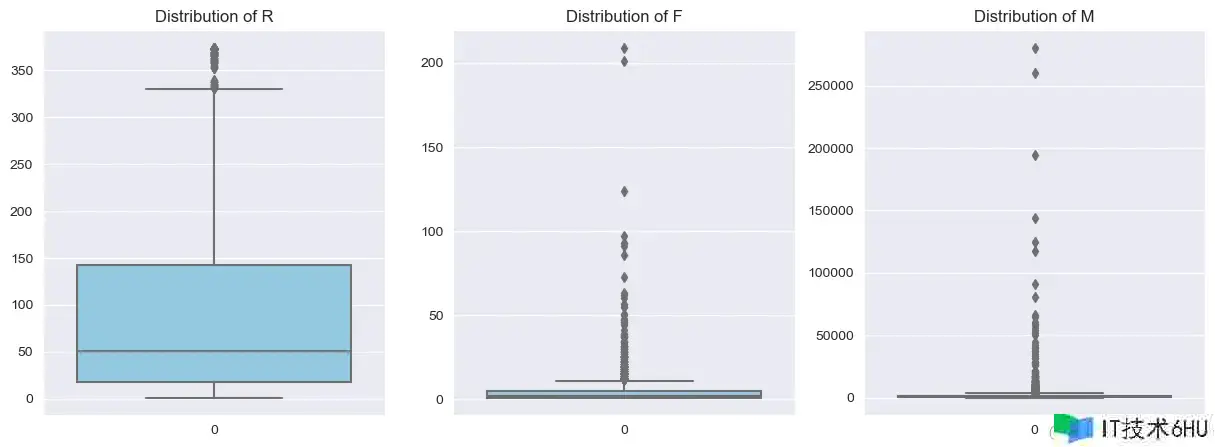
8.2 变量分布-Distribution of variables
In [104]:
columns = ["R","F","M"]
plt.figure(figsize=(15,5))
for i, j in enumerate(columns):
    plt.subplot(1,3,i+1)
    sns.boxplot(df_kmeans[j], color="skyblue")
    plt.xlabel('')
    plt.title(f"Distribution of {j}",size=12)
plt.show()
8.3 异常值处理-Outliers Dealing
以四分之一分位数和四分之三分位数为边界值进行删除:
In [105]:
Q1 = df_kmeans.R.quantile(0.05)
Q3 = df_kmeans.R.quantile(0.95)
IQR = Q3 - Q1
df_kmeans = df_kmeans[(df_kmeans.R >= Q1 - 1.5 * IQR) & (df_kmeans.R <= Q3 + 1.5 * IQR)]
In [106]:
Q1 = df_kmeans.F.quantile(0.05)
Q3 = df_kmeans.F.quantile(0.95)
IQR = Q3 - Q1
df_kmeans = df_kmeans[(df_kmeans.F >= Q1 - 1.5 * IQR) & (df_kmeans.F <= Q3 + 1.5 * IQR)]
In [107]:
Q1 = df_kmeans.M.quantile(0.05)
Q3 = df_kmeans.M.quantile(0.95)
IQR = Q3 - Q1
df_kmeans = df_kmeans[(df_kmeans.M >= Q1 - 1.5 * IQR) & (df_kmeans.M <= Q3 + 1.5 * IQR)]
In [108]:
df_kmeans = df_kmeans.reset_index(drop=True)
df_kmeans.info()
<class 'pandas.core.frame.DataFrame'>
RangeIndex: 4254 entries, 0 to 4253
Data columns (total 4 columns):
 #   Column      Non-Null Count  Dtype
---  ------      --------------  -----
 0   CustomerID  4254 non-null   float64
 1   R           4254 non-null   int64
 2   F           4254 non-null   int64
 3   M           4254 non-null   float64
dtypes: float64(2), int64(2)
memory usage: 133.1 KB
8.4 数据标准化-StandardScaler
In [109]:
df_kmeans = df_kmeans.iloc[:,1:]
df_kmeans.head()
Out[109]:
| R | F | M | |
|---|---|---|---|
| 0 | 3 | 7 | 4310.00 |
| 1 | 76 | 4 | 1797.24 |
| 2 | 19 | 1 | 1757.55 |
| 3 | 311 | 1 | 334.40 |
| 4 | 37 | 8 | 2506.04 |
In [110]:
ss = StandardScaler()
df_kmeans_ss = ss.fit_transform(df_kmeans)
In [111]:
df_kmeans_ss = pd.DataFrame(df_kmeans_ss)
df_kmeans_ss.columns = ['R','F','M']
df_kmeans_ss.head()
Out[111]:
| R | F | M | |
|---|---|---|---|
| 0 | -0.914184 | 0.882831 | 1.755148 |
| 1 | -0.185002 | 0.100802 | 0.293115 |
| 2 | -0.754363 | -0.681227 | 0.270022 |
| 3 | 2.162366 | -0.681227 | -0.558029 |
| 4 | -0.574565 | 1.143507 | 0.705526 |
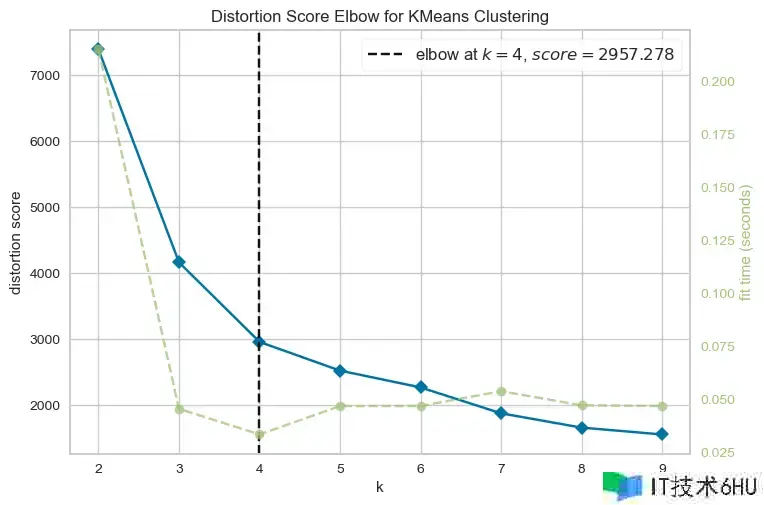
8.5 确定K值-K-Eblow
In [112]:
from yellowbrick.cluster import KElbowVisualizer
km = KMeans(init="k-means++", random_state=0, n_init="auto")
visualizer = KElbowVisualizer(km, k=(2,10))
visualizer.fit(df_kmeans_ss) # df_kmeans_ss使用数据
visualizer.show()
从结果中发现,k=4是最合适的。
8.6 聚类过程-Clustering
In [113]:
model_clus4 = KMeans(n_clusters = 4)
model_clus4.fit(df_kmeans_ss)
Out[113]:
KMeans
KMeans(n_clusters=4)
In [114]:
cluster_labels = model_clus4.labels_
cluster_labels
Out[114]:
array([3, 0, 0, ..., 0, 3, 0])
8.7 聚类结果-Result of clustering
In [115]:
df_kmeans["clusters"] = model_clus4.labels_  # 贴上每行数据的标签
df_kmeans.head()
Out[115]:
| R | F | M | clusters | |
|---|---|---|---|---|
| 0 | 3 | 7 | 4310.00 | 3 |
| 1 | 76 | 4 | 1797.24 | 0 |
| 2 | 19 | 1 | 1757.55 | 0 |
| 3 | 311 | 1 | 334.40 | 2 |
| 4 | 37 | 8 | 2506.04 | 3 |
In [116]:
df_kmeans.groupby('clusters').mean().round(0) # 每个簇群3个指标的均值
Out[116]:
| R | F | M | |
|---|---|---|---|
| clusters | |||
| 0 | 53.0 | 2.0 | 650.0 |
| 1 | 20.0 | 15.0 | 6805.0 |
| 2 | 254.0 | 1.0 | 429.0 |
| 3 | 31.0 | 7.0 | 2567.0 |
8.8 轮廓系数-Silhoutte_score
In [117]:
from sklearn.metrics import silhouette_score # 聚类效果评价:轮廓系数
silhouette = silhouette_score(df_kmeans_ss, cluster_labels)
silhouette
Out[117]:
0.4820199420011818
8.9 簇群分布-Clusters Distribution
In [118]:
columns = ["R","F","M"]
plt.figure(figsize=(15,4))
for i,j in enumerate(columns):
    plt.subplot(1,3,i+1)
    sns.boxplot(y=df_kmeans[j], x=df_kmeans["clusters"],palette="spring")
    plt.title(f"{j}",size=13)
    plt.xlabel("")
    plt.ylabel("")
plt.show()
8.10 3D可视化-Visualization
In [119]:
fig = plt.figure(figsize = (12, 5))
ax = plt.axes(projection ="3d")
ax.scatter3D(df_kmeans.R, df_kmeans.F, df_kmeans.M, c=df_kmeans.clusters, cmap='Accent')
ax.set_xlabel('R')
ax.set_ylabel('F')
ax.set_zlabel('M')
plt.title('RFM in 3D with Clusters', size=15)
ax.set(facecolor='white')
plt.show()

